
All experiments were run on PCs with Intel 3.4 GHz i7-
3770 processors, 12 GB of RAM and AMD Radeon HD 7700
series graphic cards, each running 64-bit Windows 7 Enterprise. The PCs were connected by a 100 Mbps network
LAN. The games tested, the Car Tutorial9 and Angry Bots
(version 4.0)10 are provided by Unity Technologies.
In micro experiments, we evaluated the Uniquitous server components based on the architecture from Figure 1, focusing on processing time.
Three different methods are used to measure processing times of different components:
The results of the most important component, Image Encoding is presented below. The results of other components are available in the thesis on Download page.
Figure 2 and 3 show the image encoding time versus JPEG encoding quality factor at different resolutions for each Unity project. The x axis is the JPEG quality factor, where a higher factor represents a better game image. The y axis is the encoding time, in milliseconds. Each source image resolution is depicted by a separate trend line. There is a slight increase in per-image encoding time as the quality factor goes from 0 to 80, with a sharp increase at 100. Higher resolution images take more processing time than lower resolution images and encoding times low enough to achieve a target frame rate time of 30 fps are only possible for images size 640 x 480 or smaller.
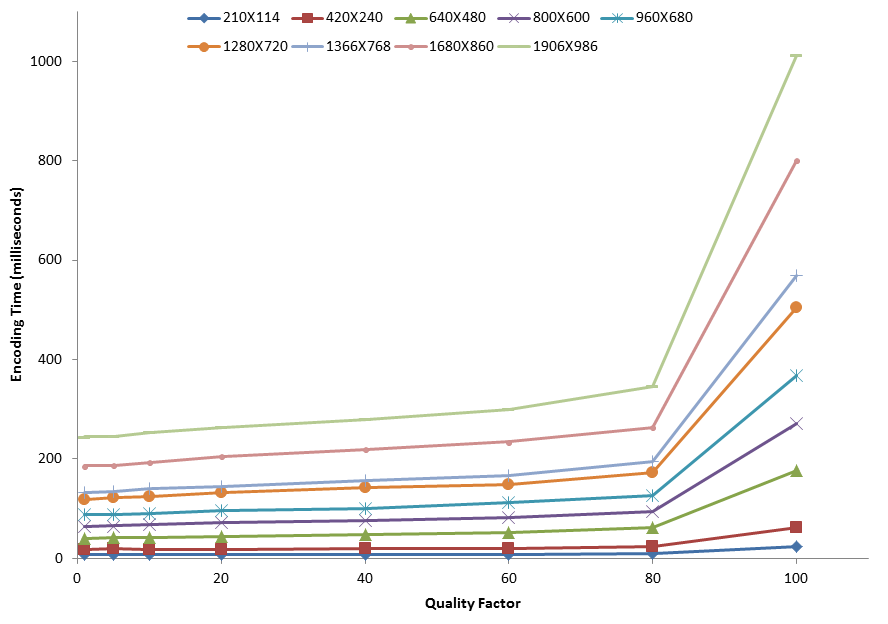
Figure 2. Image encoding time versus JPEG encoding
quality factor for Angry Bots.
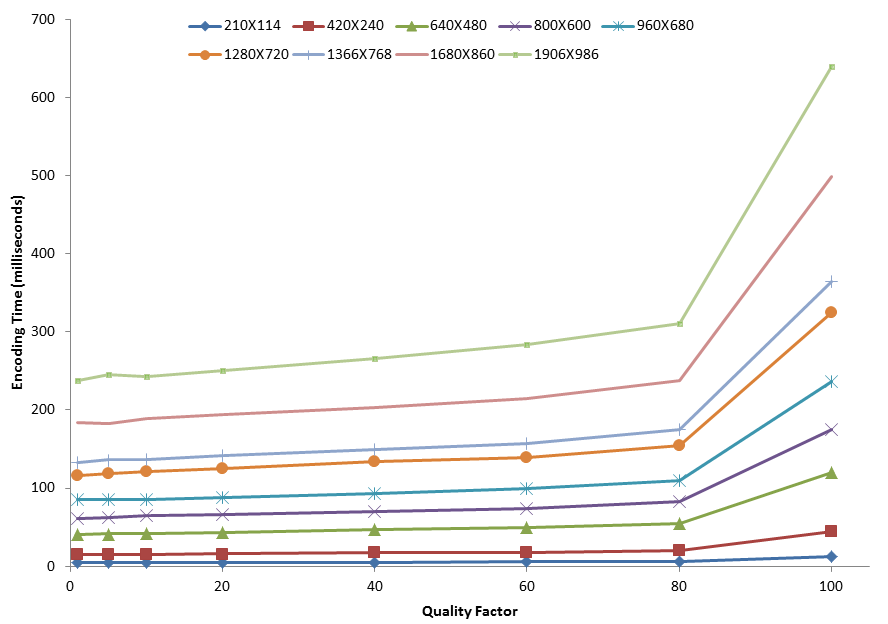
Figure 3. Image encoding time versus JPEG encoding
quality factor for Car Tutorial.
In macro experiments, we evaluated the Uniquitous system as perceived by the player, focusing on game image quality and frame rate. In addition, we discuss the work flow of the server and built several models predicting the frame rate (full details are available in the thesis on Download Page).
In order to evaluate the game image quality provided by Uniquitous, we used 200 images with 20 different compression ratios and 10 different resolutions. For reproducibility, all results derive from an image captured from Car Tutorial. Structural Similarity Index (SSIM) is used to evaluate the visual quality of the compressed images. SSIM models the image distortion as a number from 0 (low) to 1 (high) due to compression as a combination of loss of correlation, luminance distortion and contrast distortion. The SSIM results are shown in Figure 4. The x axis is the JPEG quality factor, and the y axis is the SSIM. Each point is the average SSIM per frame for an experimental run, with trendlines grouping the different screen resolutions. From Figure 4, higher resolution images have better SSIM. All lines show a marked increase in SSIM from quality factor 0-15 and modest increase from 15-35. After 35, the increase is slight or, in the case of the lowest resolutions, none. This suggests there is little visual benefit to JPEG quality factors above 35.
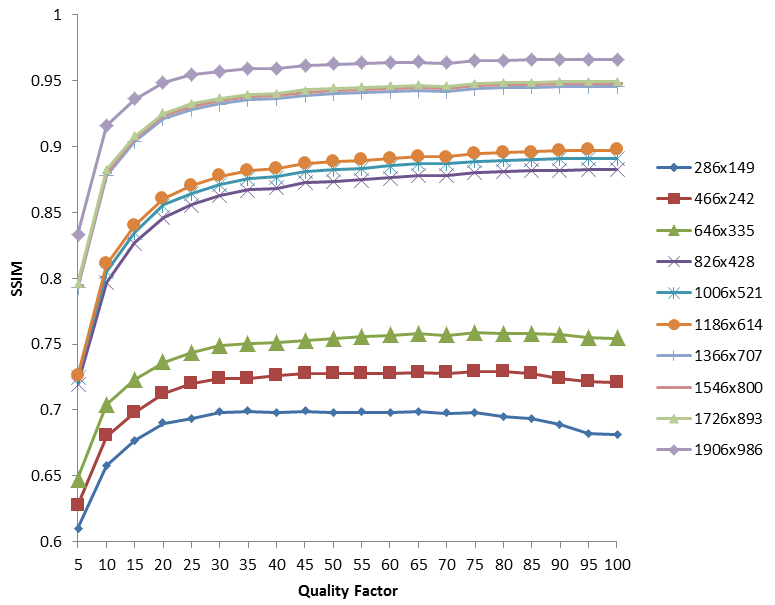
Figure 4. SSIM versus JPEG encoding quality factor
To evaluate frame rates achievable in Uniquitous, 44 configurations for Car Tutorial and 37 configurations for AngryBots were tested. Each configuration varied the JPEG encoding quality factor and resolution. To compute the frame rate, the time difference methodology provided the average frame intervals, and the inverse provided the frame rate. Figure 5 and 6 show the frame rate results for each Unity project. The x axis is the JPEG quality factor, and the y axis is the frame rate. Each point is the average of an experimental run, with trendlines grouping the different screen resolutions. Note, the higher resolution images are not tested at higher JPEG quality factors since RPC limits prevent images larger than 64 Kbytes from being transmitted. From Figure 5, Angry Bots can achieve a maximum frame rate of 41 fps at a 210 x 114 resolution and 1 JPEG encoding. With the exception of this smallest image resolution. From Figure 6, Car Tutorial can achieve a maximum frame rate of 48 fps at a 210 x 114 resolution and 1 JPEG encoding. With the exception of the smallest image resolution of 210 x 114, decreasing the JPEG quality factor does little to change the frame rate. However, increasing the frame resolution has a pronounced effect on decreasing the frame rate for both games. Based on previous results1, frame rate is more important than resolution and a game system needs to provide a minimum of 15 fps for reasonable player performance. Both games tested can achieve 15 fps at a resolution of 640 x 480, the recommended resolution setting for Uniquitous on this setup.
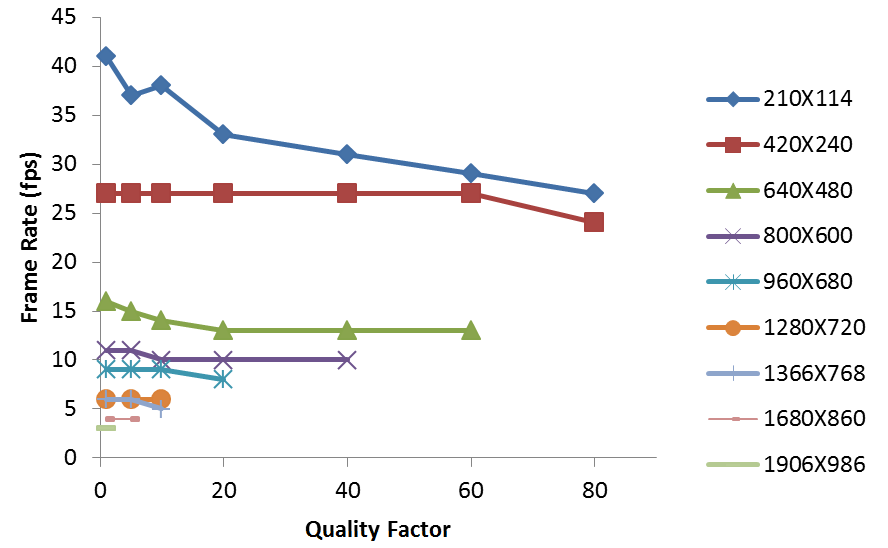
Figure 5. Frame rate versus JPEG quality factor for Angry Bots
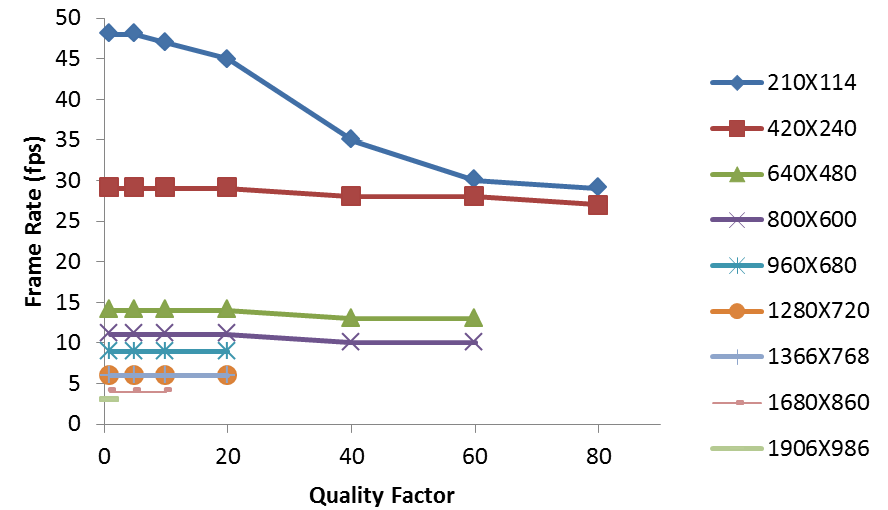
Figure 6. Frame rate versus JPEG quality factor for Car Tutorial